
Before you tour a single property, run three checks: look up the address on the FEMA Flood Map Service Center, pull its score on First Street Foundation's Flood Factor, and view projected sea-level exposure on the NOAA Sea Level Rise Viewer. These municipal-scale signals, not curb appeal or square footage, are the most reliable early indicators of whether a neighborhood will hold its value, remain insurable, and sustain the quality of life you are seeking. First Street analysts have documented how rising insurance costs tied to climate exposure are already reshaping migration and homebuying priorities across the country, placing climate risk alongside schools and waterfront access as a primary selection criterion. Why climate affects neighborhood selection is no longer a theoretical question; it is a financial and lifestyle reality that demands the same rigor you would apply to a title search.
Pro Tip: Ask the seller or landlord directly: "Has your homeowner's insurance premium increased in the past two years, and have any insurers declined to renew?" The answer reveals more about a neighborhood's trajectory than any listing description.
Key Takeaways
Climate risk shapes neighborhood value, insurability, and livability through three compounding channels: insurance market signals, price capitalization of climate amenities, and chronic exposure to heat, flooding, and infrastructure failure.
| Point | Details |
|---|---|
| Check municipal exposure first | Run FEMA, First Street, and NOAA maps before touring; save screenshots for underwriting. |
| Insurance signals lead the market | Insurer exits and premium spikes precede price declines; confirm availability before closing. |
| Chronic risks compound over time | Heat islands, nuisance flooding, and aging infrastructure erode livability over decades. |
| Municipal investment outperforms private upgrades | Neighborhoods with funded adaptation projects sustain value better than those relying on voluntary retrofits. |
| Unpriced flood risk is real | Many properties carry flood exposure not yet reflected in asking prices; negotiate accordingly. |
Table of Contents
- Your neighborhood climate checklist before you tour or make an offer
- How climate risk changes neighborhood value, insurability, and daily life
- Which climate risks matter most at the neighborhood scale
- How resilience investments reshape who lives where
- Where to check exposure and resilience: trusted maps and local records
- A framework for weighing trade-offs: risk, horizon, retrofit cost, and resale
- Red flags and green flags to watch for when touring a neighborhood
- Step-by-step actions after you identify a promising neighborhood
- A broker's perspective on climate signals in today's market
- Sources
- FAQ
Your neighborhood climate checklist before you tour or make an offer
Run these checks in order, and save screenshots at each step for use in negotiations and mortgage underwriting.
| Check | Tool or Source | What to Look For |
|---|---|---|
| FEMA flood zone designation | FEMA Flood Map Service Center | Zone AE or VE requires mandatory flood insurance; Zone X is lower risk |
| Flood Factor score | First Street Foundation / Flood Factor | Score of 7–10 signals material risk; note trend direction, not just current score |
| Sea-level rise exposure | NOAA Sea Level Rise Viewer | Select 1–3 ft scenarios to see which streets flood under near-term projections |
| Environmental justice screen | EPA EJScreen | Flags cumulative pollution burden, heat exposure, and demographic vulnerability |
| Local hazard mitigation plan | County or city emergency management website | Confirms whether the municipality has funded, active resilience projects |
| Drainage and sewer capacity | County GIS portal or public works department | Recent upgrades signal investment; aging systems amplify flood and backup risk |
| Tree canopy and heat islands | County GIS or urban forestry data | Low canopy in dense areas correlates with elevated surface temperatures |
| Air quality history | EPA AirNow or county health department | Wildfire smoke days and ozone alerts affect daily livability and health costs |
How climate risk changes neighborhood value, insurability, and daily life
The mechanism is precise: climate exposure enters home prices through three distinct channels, each compounding the others. The first is the capitalization channel. Economic location-choice models confirm that households trade off wages, housing costs, and climate amenities when selecting where to live, which means measurable willingness-to-pay for temperature differences and flood safety is already embedded in prices across most metros.
The second channel is insurance. Reinsurance market shocks have passed through to homeowner premiums and, in some exposed ZIP codes, produced detectable downward pressure on home values. When a major insurer exits a market, the remaining carriers raise premiums or restrict coverage, which narrows the pool of buyers who can secure a mortgage and, in turn, compresses demand. A property that cannot be insured at a reasonable cost is, for practical purposes, difficult to sell.
The third channel is livability. Chronic exposures, including nuisance flooding, extreme heat days, and degraded air quality, erode the daily experience of a neighborhood in ways that do not appear in a listing price until residents begin to leave. Research further indicates that many properties carry underpriced flood risk, meaning full capitalization of that exposure could materially reduce values and disproportionately harm lower-income homeowners who have the least capacity to absorb the adjustment.
Which climate risks matter most at the neighborhood scale
Not all hazards carry equal weight, and the relevant ones shift by geography. Understanding the distinction between acute and chronic exposures is the foundation of any sound neighborhood evaluation.
Acute hazards such as riverine floods, coastal storm surge, and wildfires arrive with intensity and speed. Their primary financial consequences are property damage, mandatory evacuation, and the insurance costs that follow repeated claims. A neighborhood with a history of post-disaster repair disclosures warrants particular scrutiny.
Chronic hazards accumulate quietly. Sea-level rise and high-tide flooding extend the number of days per year that low-lying streets are impassable, steadily increasing maintenance costs and reducing the window for outdoor activity. Urban heat islands, where surface temperatures in dense, low-canopy areas can run several degrees above surrounding neighborhoods, impose compounding health and energy costs. Research confirms that urban heat drives within-city residential sorting, with higher-income households systematically outcompeting others for cooler locations.

Infrastructure risks amplify both categories. Power grid fragility, aging sewer lines, and inadequate stormwater capacity transform a manageable rain event into a basement flood or a prolonged outage. These are communal systems; no amount of private investment at the property level fully compensates for a failing municipal grid.
How resilience investments reshape who lives where
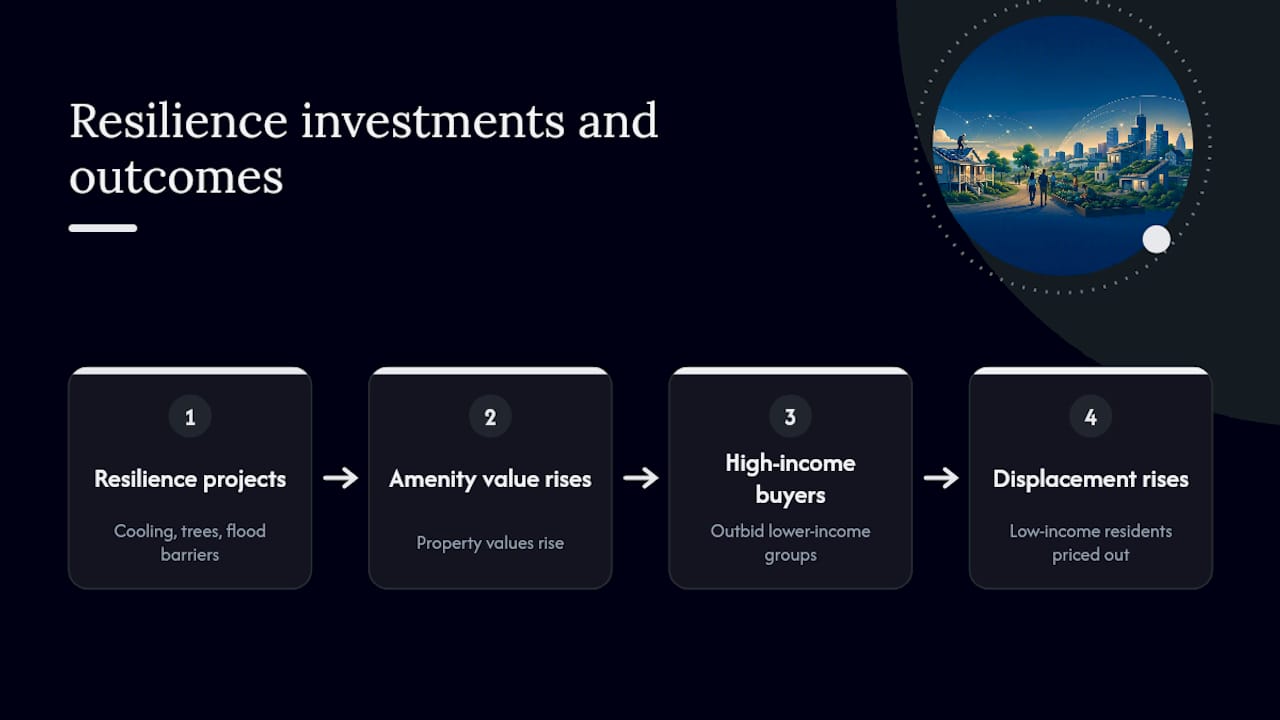
Climate adaptation spending does not distribute its benefits evenly, and discerning buyers should understand the social geometry before committing to a neighborhood. When cities invest in cooling infrastructure, green corridors, or elevated flood barriers, property values in the affected areas tend to rise. That appreciation is welcome for existing owners but can price out the lower-income residents who most needed the relief.
A discrete-choice study found that urban heat mitigation can shift competitive dynamics for housing in cooler neighborhoods, with higher-income households frequently outcompeting lower-income groups once amenity value increases. Separately, Bayesian network models calibrated to migration data in several U.S. metros show that climate risk affects within-city destination choices and can compound pre-existing patterns of segregation in receiving neighborhoods.
For buyers, this dynamic carries two practical implications. First, a neighborhood undergoing active municipal resilience investment may be pricing in future demand, meaning today's offer price already reflects tomorrow's amenity premium. Second, HUD guidance on neighborhood strategy areas underscores that detailed, place-based monitoring is necessary to distinguish genuine resilience from displacement-driven gentrification.
Pro Tip: Search the city's capital improvement plan for the neighborhood's name. Active stormwater, tree-planting, or grid-hardening projects are genuine green flags; a plan that lists only "future study" is not.
Where to check exposure and resilience: trusted maps and local records
Each tool below answers a different question, and using them in combination yields a far more complete picture than any single source.
Federal and nonprofit maps:
- FEMA Flood Map Service Center reveals the official flood zone designation that governs mandatory insurance requirements and lender underwriting. It is the starting point, though its maps are updated infrequently and may understate current risk in rapidly changing coastal areas.
- First Street Foundation / Flood Factor models current and projected flood probability at the property level, incorporating climate-adjusted scenarios that FEMA maps do not yet reflect. It is the most forward-looking publicly available tool for flood exposure.
- NOAA Sea Level Rise Viewer overlays projected inundation scenarios onto aerial imagery, allowing you to visualize which streets and parcels fall below future tidal thresholds under 1–10 ft scenarios.
- EPA EJScreen aggregates environmental burden indicators, including proximity to industrial pollution, heat exposure, and demographic vulnerability, at the census-block level. It is particularly useful for identifying cumulative risk that individual hazard maps miss.
Local sources:
County and city GIS portals often contain parcel-level data on drainage infrastructure, building permit history, and zoning overlays that federal tools do not capture. Local hazard mitigation plans, typically published by county emergency management offices, reveal which projects are funded and on what timeline. Sewer and stormwater project records from the public works department confirm whether aging infrastructure is being addressed or deferred.
Interpreting differences: FEMA maps reflect regulatory risk; First Street reflects modeled physical risk. When the two diverge, the First Street score often signals where regulatory maps have not yet caught up to physical reality, a gap that carries real financial consequence for buyers.
A framework for weighing trade-offs: risk, horizon, retrofit cost, and resale
- Define your time horizon. A five-year rental horizon tolerates more exposure than a thirty-year mortgage. Chronic risks, particularly sea-level rise and heat intensification, compound over decades, so longer horizons demand stricter thresholds.
- Estimate retrofit and mitigation costs. Elevation certificates, foundation waterproofing, defensible-space clearing for wildfire, and backup power systems carry real costs. Determine whether those costs fall on you privately or are addressed by municipal programs, and factor them into your offer or rental decision.
- Assess insurance availability, not just current premium. Call two or three local insurers before closing. If carriers are declining to write new policies in the area, that is a liquidity signal: future buyers will face the same constraint, compressing your resale pool. Experts note that municipal adaptation integrated into infrastructure is what sustains long-term insurability; a property in a municipality with active resilience investment is structurally more defensible.
- Score days on market and price history. Properties in high-risk zones that linger on the market or show repeated price reductions are reflecting buyer hesitation. That hesitation is a forward-looking signal about resale liquidity.
- Assign a go/no-go threshold. A Flood Factor score above 7, absence of available homeowner insurance at standard rates, or a FEMA Zone AE designation without documented municipal mitigation should each trigger a contingency clause or a price credit in negotiation, not a walk-away by default, but a structured acknowledgment of the risk.
Red flags and green flags to watch for when touring a neighborhood
Red flags worth pausing on: a property in a mapped hazard zone with no flood or wildfire disclosure; a seller who cannot produce current insurance declarations; repeated repair line items in the disclosure history that follow storm or flood events; and streets with no stormwater infrastructure visible during or after rain.
Green flags that signal genuine resilience: active municipal stormwater or heat-mitigation projects listed in the capital improvement plan; recent infrastructure upgrades confirmed in county permit records; high tree canopy density in a heat-exposed area; and a community emergency response plan with documented participation. Street-level observation, recommended by neighborhood environmental assessment methods, remains irreplaceable: walk the block after rain, note drainage patterns, and observe the condition of adjacent infrastructure.
Fact-check seller claims about mitigation by requesting the permit number and verifying it in the county's online permit portal. A completed permit is evidence; a verbal assurance is not.
Step-by-step actions after you identify a promising neighborhood
- Run FEMA, First Street, and NOAA checks on the specific parcel and save dated screenshots for your mortgage underwriter and insurance broker.
- Request the seller's current insurance declarations page and ask whether any insurer has declined renewal in the past three years.
- Call two local independent insurance agents to confirm market availability and current premium ranges for the property type and zone.
- Order a targeted drainage and foundation inspection, and for wildfire-adjacent properties, a defensible-space assessment by a licensed inspector.
- Pull the county building permit history for the address; repeated permits for water intrusion or structural repair are material disclosures even when not volunteered.
- Negotiate a credit or contingency clause tied to insurance availability or mitigation findings, rather than accepting the risk without acknowledgment in the contract.
Pro Tip: Request the local hazard mitigation plan from the county emergency management office. A plan with funded, time-bound projects is worth more than one that lists aspirational goals without budget allocations.
A broker's perspective on climate signals in today's market
The most consistent pattern in advising buyers, particularly those relocating from out of state, is that climate risk tends to be the last variable they consider and the one most likely to determine their long-term satisfaction with a purchase. In markets like Las Vegas, where extreme heat is a chronic and intensifying condition, the questions that matter are not merely about the property's cooling system but about the neighborhood's grid resilience, the municipality's urban heat mitigation investments, and whether the surrounding infrastructure can sustain livability through a prolonged heat event.
Insurance availability has become, in practical terms, a leading indicator of neighborhood trajectory. When carriers begin declining to write new policies in a ZIP code, the downstream effect on buyer demand and resale liquidity is measurable and often faster than the physical climate shift itself. Buyers who treat insurance as a closing formality rather than a due-diligence signal are accepting a risk that the market has already begun to price.
The most defensible position for any buyer is to combine rigorous map-based research with the kind of local, negotiation-informed guidance that translates data into offer strategy. Yhluxrealestate's relocation concierge and negotiation services are structured precisely to bridge that gap, ensuring that climate and infrastructure findings inform every stage of the transaction, from initial neighborhood screening through final contract terms.
Sources
- How Climate Change Could Upend the American Dream — ProPublica
- Household location decisions and the value of climate amenities (selected excerpts)
FAQ
Why does climate affect neighborhood selection so directly?
Climate exposure shapes insurance availability, mortgage access, and resale liquidity, all of which determine a property's long-term financial viability. Households also trade off climate amenities against wages and housing costs when choosing where to live, meaning climate conditions are already capitalized into prices.
Which tool gives the most accurate flood risk for a specific address?
First Street Foundation's Flood Factor provides the most forward-looking property-level flood probability, incorporating climate-adjusted scenarios that FEMA's regulatory maps have not yet updated to reflect. Use both together for a complete picture.
How do insurance market changes signal neighborhood risk?
When insurers decline to write new policies or raise premiums sharply in a ZIP code, buyer demand contracts and resale liquidity narrows. Research documents that reinsurance shocks have already produced detectable downward pressure on home values in high-risk areas.
Can a neighborhood's climate risk be mitigated after purchase?
Private retrofits, such as elevation, waterproofing, and defensible-space clearing, reduce property-level exposure but cannot substitute for municipal infrastructure investment. Experts find that durable neighborhood resilience requires adaptation integrated at the municipal level, not voluntary upgrades alone.
What is the single most important climate check before making an offer?
Confirm that standard homeowner insurance is available at a reasonable premium from at least two carriers. A property that cannot be insured at market rates is structurally difficult to sell, regardless of its physical condition or current asking price.