
Las Vegas cap rates in 2026 sit in a broad band, roughly 3.5% for premium single-family and luxury holdings up to nearly 7% for market-average multifamily assets, according to NextGen Properties. The single biggest force reshaping those numbers is financing cost, not rent growth: mid-6% debt is compressing real cash-on-cash returns even where headline yields look attractive. What follows breaks that range down by property type and submarket, then shows how to underwrite past the headline number to a realistic cash flow projection.
TL;DR:
- Cap rates for premium single-family homes in Las Vegas range from 3.5% to 4.5%, while market-average multifamily assets hover around 7%, mainly driven by financing costs.
- Structural factors like property price, HOA fees, and property taxes significantly impact net yield and must be carefully considered when evaluating deal profitability.
- Multifamily cap rates are stable around 7%, with concessions and softer sales volume slightly influencing the actual return prospects.
- Luxury property cap rates are even lower, but buyers should focus on appreciation potential and account for high operational costs instead of yield alone.
- Accurate underwriting requires adjusting for concessions, vacancy, expenses, reserves, and stress-testing financing, as quoted cap rates often overstate actual cash flow.
Table of Contents
- What Are Current Cap Rates in Las Vegas by Property Type?
- How Are Multifamily Fundamentals Moving Cap Rates?
- What Cap Rates Should Luxury Buyers Expect?
- How Do You Read a Cap Rate Correctly?
- How Do You Underwrite a Las Vegas Deal Properly?
- Yelena Horton's Perspective: Reading the Numbers Like a Local
- How Yhluxrealestate Turns Cap-Rate Data Into a Closed Deal
- Sources
- FAQ
What Are Current Cap Rates in Las Vegas by Property Type?
Cap rate compression and widening rarely move uniformly across a metro this varied. A Henderson luxury estate and a North Las Vegas fourplex answer to entirely different buyer pools, expense structures, and financing terms, and the variation between them tells you more about the market than any single average ever could.
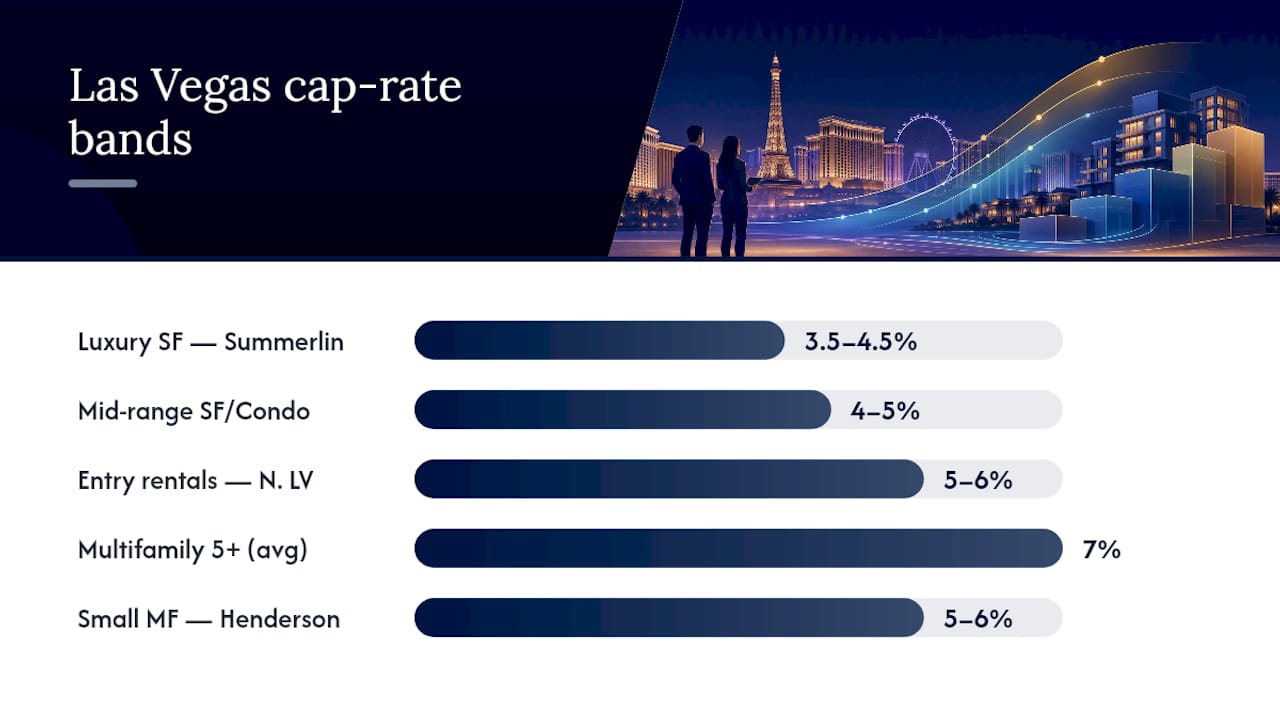
The clearest published bands come from a local Las Vegas cap-rate breakdown that separates the market into three tiers: premium pockets running 3.5% to 4.5%, mid-range product at 4% to 5%, and entry-level rentals reaching 5% to 6%, according to iRES Vegas. Multifamily assets, particularly larger 5+ unit properties trading in institutional-adjacent deals, average near mid-to-high single digits marketwide, per NextGen Properties, a spread wide enough that it draws capital straight out of coastal California in search of yield.
Here is how those bands typically break out across submarkets and asset classes:
| Property type / submarket | Typical cap-rate band | Primary yield driver |
|---|---|---|
| Luxury single-family (Summerlin, The Ridges) | 3.5%–4.5% | Appreciation over yield |
| Mid-range single-family / condo | 4%–5% | HOA fees, tax burden |
| Entry-level rental (North Las Vegas) | 5%–6% | Lower price basis, higher turnover |
| Multifamily 5+ units, market average | 7% | Rent growth vs. financing cost |
| Small multifamily (Henderson, Southwest LV) | 5%–6% | Tenant mix, unit condition |
A few structural factors explain why these bands sit where they do rather than clustering around one market number:
- Price level matters more than almost anything else. A $1.8 million Ridges estate produces modest rental yield relative to its basis, which is precisely why buyers there are underwriting for appreciation, not income.
- HOA fees erode net yield fast in condo-heavy submarkets, sometimes shaving a full point off an otherwise respectable gross number.
- Property tax assessments vary by jurisdiction within Clark County, and reassessment timing can shift net yield year to year.
- Tenant mix, whether workforce renters in North Las Vegas or executive tenants in Summerlin leaseback arrangements, changes both vacancy risk and achievable rent growth.
Southwest Las Vegas and Henderson tend to land in the middle of these bands, offering neither the yield compression of trophy Summerlin addresses nor the higher-risk, higher-yield profile of older North Las Vegas stock.
How Are Multifamily Fundamentals Moving Cap Rates?
Deliveries are still running hot enough to matter. Cushman & Wakefield's Q2 2026 MarketBeat tracked 1,720 new multifamily units delivered across six properties in the quarter alone, adding to a meaningful year-to-date total that keeps supply pressure on lease-up pricing in newer submarkets.
That supply is landing against a demand backdrop that remains structurally sound. Population growth tracked by the U.S. Census Bureau continues to support occupancy even as new units absorb into the market, though absorption in any single quarter can lag deliveries enough to nudge vacancy upward temporarily.
Three trends are worth watching closely:
- Concessions have crept back into newer lease-ups, meaning quoted asking rents overstate what owners actually collect, a gap that directly shrinks effective NOI and, by extension, the real cap rate a buyer is purchasing.
- Sales volume for stabilized multifamily assets has moderated compared to the peak liquidity years, which tends to widen observed cap rates slightly as fewer aggressive buyers compete for deals.
- Out-of-state capital keeps flowing in anyway, chasing the yield spread over coastal markets described by NextGen Properties, which offsets some of that widening pressure in the most desirable submarkets.
The net effect: multifamily cap rates in Las Vegas are neither compressing sharply nor blowing out. They are drifting in a narrow range around that 7% market average, with the real variable being how much of the quoted rent an operator actually converts into collected income once concessions and turnover are accounted for.
What Cap Rates Should Luxury Buyers Expect?
Premium neighborhoods post the tightest cap rates in the market, and that is by design, not by accident. Summerlin, The Ridges, and MacDonald Highlands properties typically land in the 3.5% to 4.5% band, according to iRES Vegas, figures that would look unattractive to a pure income investor and entirely reasonable to a buyer thinking about long-term appreciation and lifestyle value.
Non-operating costs matter more here than almost anywhere else in the market. A luxury estate in The Ridges carries HOA dues, guard-gated community fees, and a property tax bill that can reduce the headline cap rate significantly before maintenance costs. Consider what actually drags a gross cap rate down to net in this tier:
- HOA and community association fees in guard-gated developments often run into the thousands annually and rarely appear in a listing's headline yield calculation.
- Property tax on high-value parcels compounds the effect, particularly following reassessment cycles.
- Landscaping, pool service, and security monitoring on estate-sized lots add recurring costs that a standard single-family rental model does not carry.
Pro Tip: Never evaluate a luxury property on cap rate alone. If a buyer is underwriting a Summerlin or MacDonald Highlands purchase purely on yield, they are asking the wrong question. Appreciation, not income, is typically the return driver at this price point, and the deal should be framed that way from the first conversation.
For buyers weighing a luxury condo specifically, the expense structure runs closer to what a luxury condo buyer needs to understand before closing, since association fees there compress net yield even further than in single-family luxury product.
How Do You Read a Cap Rate Correctly?
A cap rate is net operating income divided by purchase price, and that single ratio hides more than it reveals unless you know exactly what sits inside the NOI figure. Gross cap rate calculations, the ones most often quoted in listings, frequently omit expense categories that materially change what an investor actually nets.
Reading a quoted cap rate correctly means working through it in order:
- Confirm what NOI includes. A legitimate NOI accounts for property management fees, insurance, property tax, routine maintenance, and a reserve allowance, not just rent collected minus a mortgage payment.
- Separate gross from net. A gross cap rate on a listing sheet is a marketing number. The reliable measure for actual deal evaluation is the net cap rate, calculated after every real operating expense is deducted.
- Check for deferred maintenance. Any property with visible deferred maintenance needs a downward NOI adjustment before the cap rate means anything.
- Understand that financing does not touch the cap rate itself. Cap rate is calculated independent of debt, but loan terms determine whether that yield translates into positive cash flow. A property purchased at a 6% cap rate with mid-6% financing, the current headwind flagged in local multifamily reporting, can produce cash flow far thinner than the cap rate suggests, sometimes negative once debt service is fully loaded.
- Factor in tax treatment separately. Structures like a like-kind exchange affect after-tax return but never change the cap rate itself, a distinction investors frequently blur.
The gap between a quoted cap rate and a property's real performance is almost always explained by one of these five steps, not by anything mysterious about the market.
How Do You Underwrite a Las Vegas Deal Properly?
Turning a headline cap rate into a projection worth trusting takes a disciplined sequence, not a single spreadsheet formula. Run through this checklist before committing to any Las Vegas acquisition, luxury or multifamily:
- Recalculate effective rent after concessions. Strip out any move-in specials or free-month offers baked into asking rent before touching NOI.
- Model realistic vacancy and turnover. Use submarket-specific figures rather than a flat 5% assumption across every property type.
- List every operating expense line item. Include management, insurance, property tax, HOA where applicable, and routine maintenance, not an estimated blended percentage.
- Set aside genuine reserves. Capital expenditure reserves for roofing, HVAC, and appliance replacement should be funded, not assumed away.
- Stress-test debt service at a higher rate. Model the deal at a rate a full point above current financing to see whether cash flow survives a refinancing environment shift.
- Run parallel metrics beyond cap rate. Cash-on-cash return, debt service coverage ratio, and break-even occupancy each reveal something the cap rate alone cannot.
Pro Tip: Watch for three red flags in any pitch deck: rent growth assumptions above 4% to 5% annually with no supporting submarket data, an expense ratio that looks suspiciously low relative to comparable properties, and reserve line items that are missing entirely. Any one of these should slow the deal down.
The value-add strategy many multifamily buyers are pursuing this cycle, closing rent gaps on undermanaged assets rather than chasing day-one yield, only works if this checklist gets run honestly before closing, not after.
Yelena Horton's Perspective: Reading the Numbers Like a Local
Cap-rate tables tell you where the market averages sit. They rarely tell you whether a specific Summerlin estate or Henderson multifamily deal is the right fit for a specific buyer's goals. That gap is where off-market access and a genuinely local read on submarket nuance matter most, particularly for out-of-state buyers relocating through our concierge process and leaning on the global reach of Sotheby's International Realty.
I have walked luxury buyers through deals where the headline cap rate looked mediocre on paper, yet the appreciation trajectory and lifestyle value made it the clear right call. Numbers matter. Context decides.
— Yelena
How Yhluxrealestate Turns Cap-Rate Data Into a Closed Deal
Reading a cap-rate table is one thing. Acting on it in a market where the best luxury inventory rarely hits public listings is another entirely. The company offers investors and relocating buyers services beyond spreadsheet analysis: access to off-market Las Vegas properties, negotiation strategies, and a relocation concierge assisting with out-of-state move logistics from first showing to closing.

That combination matters most in exactly the submarkets covered above, where a half-point difference in net cap rate can hinge on a property's tax assessment history or HOA structure that never appears in a public listing. Buyers weighing a total-return strategy, yield plus appreciation, can also review how seller net proceeds factor into exit planning before committing capital. Out-of-state buyers relocating for tax or lifestyle reasons can start with our guide to planning a cross-country move to a luxury home, then reach out through Yhluxrealestate to schedule a conversation about current off-market inventory that fits their underwriting targets.
Sources
- Las Vegas Cap Rates 2026: Nevada Multifamily Guide | NextGen Properties Insights
- Cap Rates in the Las Vegas Rental Market in 2026
- Federal Housing Finance Agency
FAQ
Are House Prices Dropping in Las Vegas?
Home prices have moderated rather than collapsed, tracking closely with the broader house price trends the FHFA publishes nationally, and the moderation is a key reason multifamily cap rates have stayed near current levels rather than compressing further.
Is a 3% Cap Rate Good in Las Vegas?
A 3% cap rate is low even for Las Vegas' tightest luxury pockets, where premium neighborhoods typically run 3.5% to 4.5%, according to iRES Vegas; a 3% deal only makes sense when appreciation potential clearly outweighs current income.
Is Las Vegas Growing or Declining?
Las Vegas continues to add population and jobs according to Census Bureau estimates, and that growth remains the demand-side support keeping multifamily occupancy and rents resilient even as new deliveries add supply.
Is $100,000 a Good Salary in Las Vegas?
A household income at a comfortable level covers median housing costs in most Las Vegas submarkets, though it stretches further in entry-level areas like North Las Vegas than in premium Summerlin or Henderson pockets where luxury pricing runs considerably higher.
What Is Driving Cap-Rate Spreads Between Las Vegas and California?
Out-of-state investors are chasing the yield gap over coastal markets, a dynamic that NextGen Properties identifies as a direct driver of continued transaction activity and capital inflow into Las Vegas multifamily assets.