
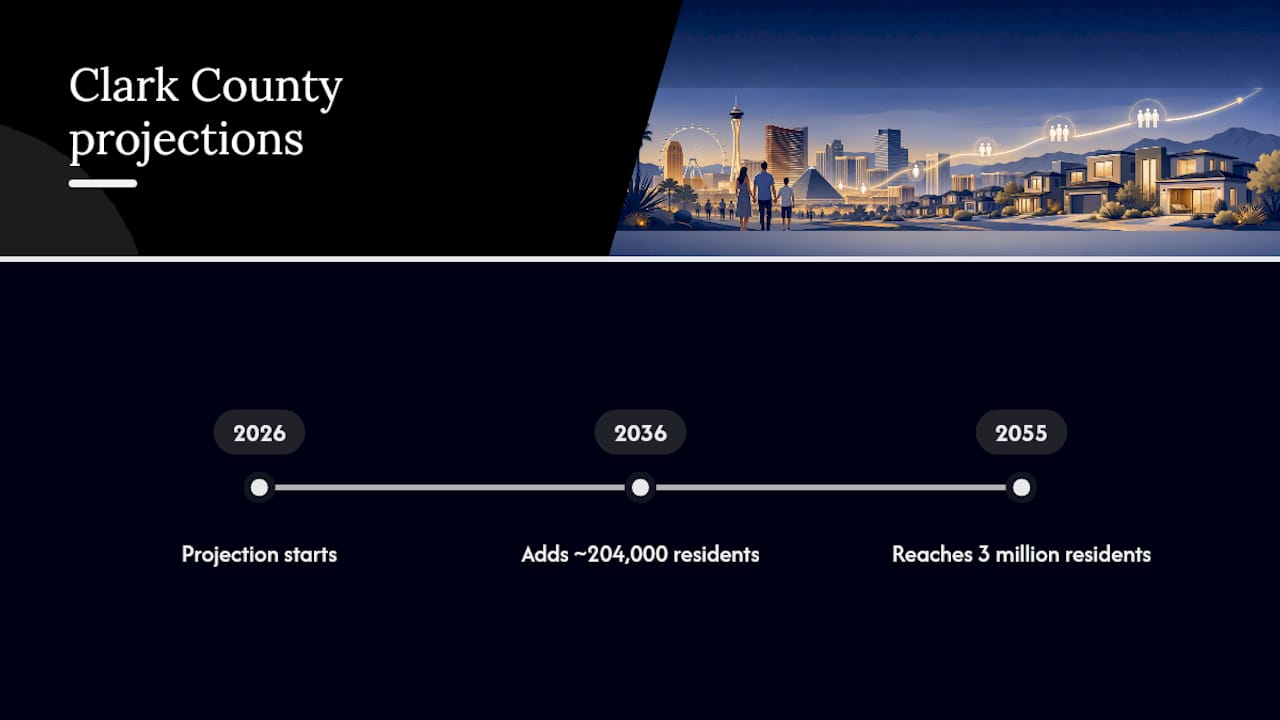
Slower population growth alone will not trigger a marketwide decline in Las Vegas home values, because a hard ceiling on new land and steady GDP growth continue to prop up the market even as migration cools. Two facts anchor that claim. First, UNLV's Center for Business and Economic Research now projects Clark County will not reach 3 million residents until 2055, a full decade later than earlier estimates assumed. Second, federal land ownership around the valley has capped buildable acreage for years, and that scarcity does not disappear just because population growth decelerates.
Those two forces work against each other in a way that matters for anyone watching values closely. Fewer new residents mean less raw demand pressure, but a tighter supply pipeline means the region absorbs even modest demand growth without flooding the market with new inventory. The result tends to be a market that cools in pace, not in direction.
If you are weighing a purchase, a sale, or a hold decision right now, here is where to focus:
- Read the UNLV forecast section below to understand exactly how much growth is slowing and why.
- Check the supply-constraint section to see why land scarcity acts as a price floor.
- Scan the signals-to-monitor list near the end if you want a short checklist of leading indicators worth tracking quarterly.
Key Takeaways
Land scarcity and continued GDP growth mean Las Vegas home values are positioned to hold through UNLV's slower population forecast rather than collapse alongside it.
| Growth is slowing, not stopping | CBER projects the 3 million milestone arriving in 2055, with annual growth easing from 1.6% to about 0.6% by 2029. | Land scarcity sets a floor | Federal land ownership around the valley caps new supply regardless of demand shifts. | | GDP growth backs prices | Clark County's real GDP is projected to nearly double by 2060, supporting jobs and wages. | | Submarkets diverge sharply | Northwest and Henderson corridors absorb more in-migration than built-out neighborhoods. | | Permits lead prices by months | Building permits and multifamily starts signal supply shifts 12 to 18 months ahead of price data. |
Table of Contents
- How Las Vegas Population Growth Affects Values Starts With UNLV's Forecast
- Why Is Population Growth Slowing in the Las Vegas Valley?
- How Population Shifts Actually Move Home Prices
- The Land Floor That Keeps Values From Collapsing
- Rental Markets and Submarkets Don't Move Together
- What Buyers and Investors Should Do With This Information
- Signals Worth Tracking Every Quarter
- How Sellers Should Approach a Slower-Growth Market
- Yelena Horton's Read on This Market Shift
- What This Slowdown Really Means for Values
- Sources
- FAQ
How Las Vegas Population Growth Affects Values Starts With UNLV's Forecast
Every conversation about Las Vegas real estate values now runs through one document: UNLV CBER's 2026 population forecast. The headline number is stark. Clark County's march toward 3 million residents, once expected by the mid 2040s, has been pushed back to 2055. That is not a minor revision. It reflects a real slowdown in the pace of arrivals, not just a rounding adjustment to an old model.
The mechanics behind that delay matter more than the milestone itself.
- Annual population growth is projected to fall from 1.6% in 2026 to roughly 0.6% by 2029, a sharp deceleration in just three years.
- Clark County is still expected to add a substantial number of residents between 2026 and 2036, so growth continues, just at a slower clip.
- Natural change (births minus deaths) is projected to turn negative in the early 2030s, meaning nearly all future growth after that point depends on migration rather than local births.
Statistic callout: UNLV also forecasts Clark County's real GDP climbing from about $200.8 billion in 2026 to $370.5 billion by 2060, a figure that matters more to home values than the population count itself. Economic output that keeps expanding, even alongside a slower population curve, keeps wages and job creation intact, and wages are what actually pay mortgages.
That distinction between headcount and economic capacity runs through the rest of this analysis, because it explains why a slower population trajectory does not automatically translate into softer prices.
Why Is Population Growth Slowing in the Las Vegas Valley?
Three forces are pulling the growth rate down at once, and each one behaves differently over time.
- Migration flows have thinned out. Domestic in-migration, the engine that built Las Vegas into a boomtown for three decades, has cooled as national relocation patterns shift and immigration policy at the federal level tightens the international pipeline that once supplemented local population gains.
- The in-migrant mix has aged. A growing share of new arrivals are retirees drawn by Nevada's tax structure and climate rather than working-age households chasing job openings. Retirees buy homes, but they do not fill the same volume of entry-level rental units that younger arrivals typically need.
- Birth rates keep falling, and sending states are less generous with migrants. Lower birth rates nationally reduce the pool of young families that historically moved west, and states that once exported residents to Nevada have seen their own cost-of-living pressures ease relative to a decade ago, giving would-be movers less reason to leave.
None of these drivers is temporary. They reflect structural shifts in national demographics, not a one-year blip tied to interest rates or a single economic cycle. That is precisely why UNLV's researchers built a decade-long delay into their 3 million forecast rather than a modest one-year adjustment.
How Population Shifts Actually Move Home Prices
Raw population figures make for a clean headline, but they are a blunt instrument for predicting values. What matters more is household formation: the rate at which people, whether new arrivals or existing residents, form new housing units by buying homes, signing leases, or moving out of a parent's spare room. A metro area can add 50,000 people who mostly move in with relatives and barely dent housing demand, or add 30,000 people who each form a new household and create far more pressure on inventory.
Employment composition matters just as much. A market adding high-wage jobs in healthcare systems, tech operations, and logistics hubs supports price resilience in the upper price tiers even when overall headcount growth slows, because those workers have both the income and the credit profile to buy rather than rent. Las Vegas has leaned into exactly this kind of diversification over the past decade, moving beyond a hospitality-only economic base.
- Household formation, not gross population, drives the number of transactions in a given year.
- Wage composition determines which price tiers see the strongest demand.
- Construction lags demand by 12 to 24 months, from permit to completed sale, which is why prices can dip even when the underlying population trend is stable.
That last point explains a pattern that confuses a lot of casual market watchers: rents or prices softening in a given quarter even though the long-term population story still looks solid. The lag between permitting and completion means supply sometimes catches up to demand at the exact moment demand cools slightly, creating a temporary air pocket in an otherwise steady market.
Pro Tip: Don't judge a single quarter's price dip against a decade-long population trend. Check whether completions spiked that same quarter before assuming demand has permanently weakened.
The Land Floor That Keeps Values From Collapsing

Las Vegas sits in a valley ringed by federally controlled land, and that geography does more to set a price floor than any single demand indicator. The Bureau of Land Management controls a substantial share of the acreage surrounding the developed valley floor, which means the region cannot simply annex its way to unlimited new subdivisions the way sprawling Sun Belt metros sometimes can.
Local reporting on the CBER slowdown has flagged this land crunch directly, noting that a limited supply of privately held, buildable parcels continues to constrain new housing deliveries even as demand growth moderates. Land scarcity around the valley acts as a structural support: even with slower growth, values are unlikely to collapse absent a genuine economic shock.
- Large master-planned communities, once a routine feature of Las Vegas's growth story, are becoming rarer and considerably more expensive to entitle and deliver.
- Infrastructure costs (roads, water rights, utility extensions) rise as remaining parcels sit farther from existing service lines, adding time and expense to every new project.
- Permit capacity at the county level effectively caps how fast new supply can hit the market, regardless of how much demand exists.
Statistic callout: With annual population growth cooling toward roughly 0.6% by 2029, the demand side of the ledger is easing off. But the supply side has not loosened at all, and that asymmetry is the real reason a slower population curve does not translate cleanly into falling prices.
Rental Markets and Submarkets Don't Move Together
Metro-wide population statistics flatten out differences that matter enormously to landlords and investors. IRES's rental market analysis finds that population growth supports rent growth over the long run, but the relationship is far from linear. Submarket absorption and the local permits pipeline drive near-term rent performance far more than the county-level headcount does.
Northwest Las Vegas, the Henderson growth corridors, and newer master-planned communities continue to attract the bulk of in-migration, while older, already built-out neighborhoods see comparatively flat household growth. That divergence means a landlord holding property in a high-absorption corridor can see rent growth even in a quarter when countywide numbers look soft.
- Track building permits and employment announcements by corridor, not just by county, since growth concentrates unevenly.
- Retiree-heavy submarkets behave differently than family-heavy or hospitality-worker-heavy ones, with retirees favoring lower-maintenance product and family households favoring larger floor plans near schools.
- A submarket with heavy multifamily completions can soften even while the broader rental market tightens elsewhere in the valley.
Metro averages are a starting point, not a decision tool.
What Buyers and Investors Should Do With This Information
Given a slower but still positive growth trajectory layered on top of a hard supply ceiling, certain property types are better positioned than others.
- Favor prime single-family homes and luxury estates in supply-constrained corridors. These sit closest to the land-scarcity floor and benefit most from the mismatch between demand and buildable acreage.
- Consider well-positioned condos aimed at the retiree wave, since that buyer segment is growing as a share of total in-migration even as overall population growth slows.
- Run a three-factor check before any purchase: current permit activity in the target corridor, recent employment announcements nearby, and household formation trends in that specific submarket rather than the county overall.
Pro Tip: Treat permits, jobs, and household formation as a single scorecard. A corridor that scores well on two of three is worth a closer look; a corridor that scores well on all three rarely stays underpriced for long.
For portfolio holders, the calculus is straightforward. Properties in land-constrained, high-absorption corridors are worth holding through short-term softness. Properties in oversupplied submarkets with heavy multifamily pipelines are better candidates for renovation and repositioning, or for selling into current demand before more completions arrive.

Signals Worth Tracking Every Quarter
A handful of leading indicators tell you where the market is headed six to eighteen months out, long before price data confirms it.
- Building permits and multifamily starts, since a spike in either signals new supply arriving in 12 to 18 months.
- Employment and wage announcements in healthcare, tech, and logistics, the sectors currently doing the heavy lifting for Clark County's GDP growth.
- Migration counts, vacancy rates, and rent growth, reviewed quarterly rather than annually, since the slowdown described by CBER unfolds gradually rather than in a single dramatic shift.
Watching these four data points together beats reacting to any single headline population figure.
How Sellers Should Approach a Slower-Growth Market
Sellers holding a low locked-in mortgage rate, or sitting in a corridor with genuine demand pockets (retiree-heavy neighborhoods, top school zones, view lots), generally benefit from listing now rather than waiting for the next growth cycle to prove itself. Waiting rarely pays off when supply stays this constrained.
- Market toward the buyer profile actually growing: retirees and higher-income out-of-state arrivals, who respond to messaging about tax treatment, low-maintenance living, and lifestyle rather than school district rankings alone.
- Understand seller concession pitfalls before negotiating, since overcorrecting on concessions in a slower market can erode net proceeds unnecessarily.
- Use staged price adjustments rather than one large cut, since a constrained-supply market usually rewards patience over panic pricing.
Yelena Horton's Read on This Market Shift
The forecast slowdown from UNLV doesn't scare me. What interests me is the mismatch it creates: fewer buyers chasing a supply that was already scarce before the slowdown began. That mismatch is where off-market opportunities live.
Yelena Horton built her practice around exactly this kind of dislocation. Her access to off-market luxury listings means clients see opportunities before permit data or absorption trends become obvious to the broader market. Her relocation concierge service caters directly to the out-of-state retirees and high-net-worth arrivals now making up a larger share of in-migration, and her connection to Sotheby's International Realty's global network gives sellers reach well beyond the Las Vegas valley.
Pro Tip: If you're relocating from out of state, ask any agent you're considering how they track submarket permit activity. Yelena reads that data corridor by corridor, not just countywide, which is exactly the granularity a slower-growth market demands.
What This Slowdown Really Means for Values
The conventional read on any population slowdown assumes prices must soften in lockstep. That assumption breaks down here because it treats headcount as the only variable that matters, ignoring what UNLV's own GDP projections and the valley's land constraints actually imply.
What gets overlooked most often is the buyer mix shift. Retirees and high-income out-of-state arrivals now make up a larger share of in-migration, and that group buys differently than the young families who once drove Las Vegas's fastest growth years. Prioritize submarket permit and employment data over county-level population totals. That is where the real signal lives, and it is what separates a defensible investment thesis from a headline-driven guess.
Sources
- CBER Population Forecast: Clark County's Path to 3 Million Slows by a Decade | UNLV News
- Las Vegas population growth and rental demand 2026 | IRES
FAQ
Will Las Vegas be livable in 2050?
Yes. UNLV's forecast shows continued, if slower, growth through 2055, with the region still adding population and jobs well beyond that date, supported by GDP projected to nearly double by 2060.
Is Las Vegas gaining or losing population?
Las Vegas is still gaining population, but at a slower pace: annual growth is projected to fall from 1.6% in 2026 to about 0.6% by 2029, with natural change turning negative around 2032.
How has the population of Las Vegas grown?
Clark County has grown steadily for decades through strong domestic migration, and UNLV now projects it will add roughly 204,000 more residents between 2026 and 2036 en route to 3 million by 2055.
Why are so many people moving out of Las Vegas?
Migration hasn't reversed so much as slowed, driven by tighter national migration patterns, an aging mix of in-migrants favoring retirement over job relocation, and reduced pressure from sending states with easing cost-of-living gaps.